I’m interested in how data visualization techniques can be automated and made more intuitive for researchers and scientists. I’ve conducted user experience and design research for the visualization tool VizDeck, a web-based visualization system for relational data that uses a card game metaphor and automatic visualization techniques to assist scientists and researchers in creating interactive visual dashboard applications.
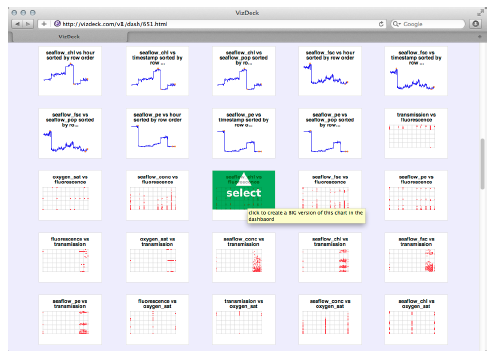
VizDeck allows users to create interactive dashboards in seconds by allowing the system to automatically analyze data and recommend a set of appropriate visualizations. Our research showed that users can complete tasks with greater speed and accuracy when compared with similar existing visual analytics tools.
My Role: Experimental design of evaluation, user testing, and statistical analysis of results.
Research Publications:
VizDeck: Streamlining Exploratory Visual Analytics of Scientific Data. Perry, D., Howe, B., Key, A., & Aragon, C. Proceedings of the 2013 iConference (2013). PDF.
VizDeck: Self-Organizing Dashboards for Visual Analytics. Key, A., Howe, B., Perry, D., Aragon, A. Proceedings SIGMOD Conference (2012 Demo & Short Paper). PDF.